Data Cardinality
Problem
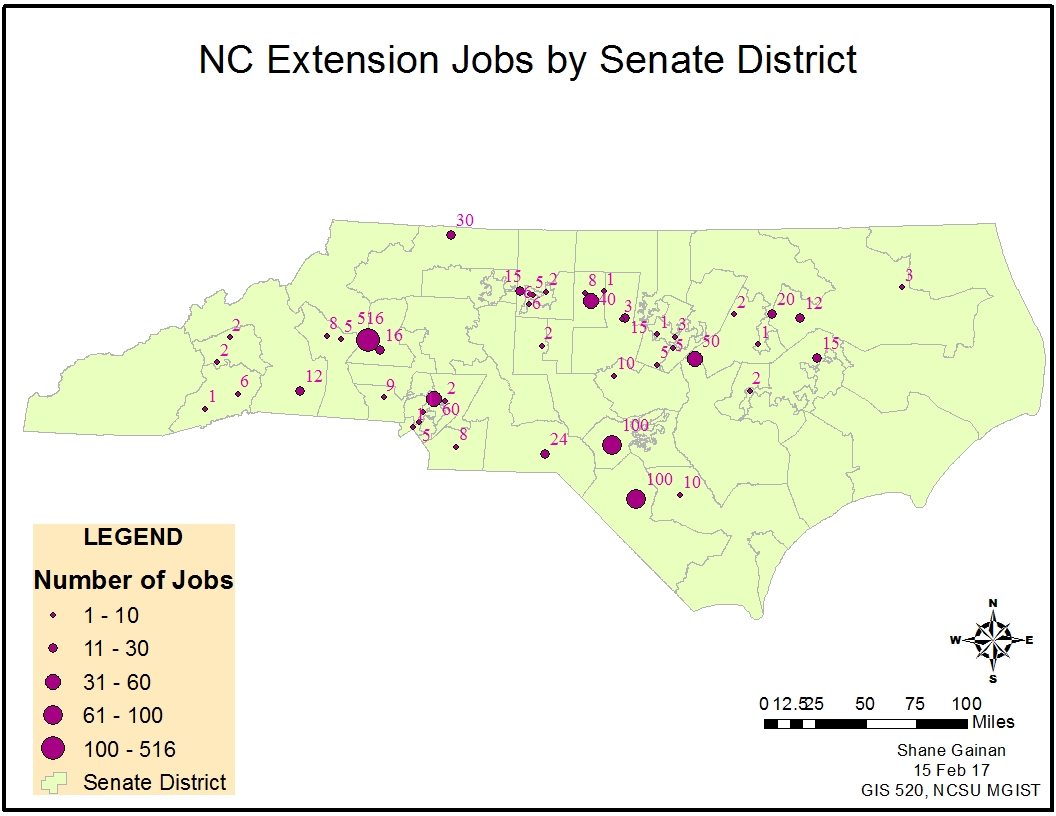
NC House and Senate District Job Creation: The project deliverables included two maps showing the job creation with the state of North Carolina by the Senate and House Districts that the jobs were in. The number of jobs needs to be clearly stated on the map and districts visible to provide a graphical display of which districts had job creation and those that did not have job creation.
Analysis procedures
Strategies
The data in this exercise was comprised of an excel spreadsheet containing the results of a NC Job Creation Survey. I then downloaded two files from the NC One Map Geodata Portal in which I downloaded the NC Senate and House District shape files. I then went to www.arcgis.com and downloaded the USA Zip code point’s layer package to import into ArcMap. The primary tools used in this exercise were ArcMap and ArcCatalog and the tools within such as select by attribute.
Methods
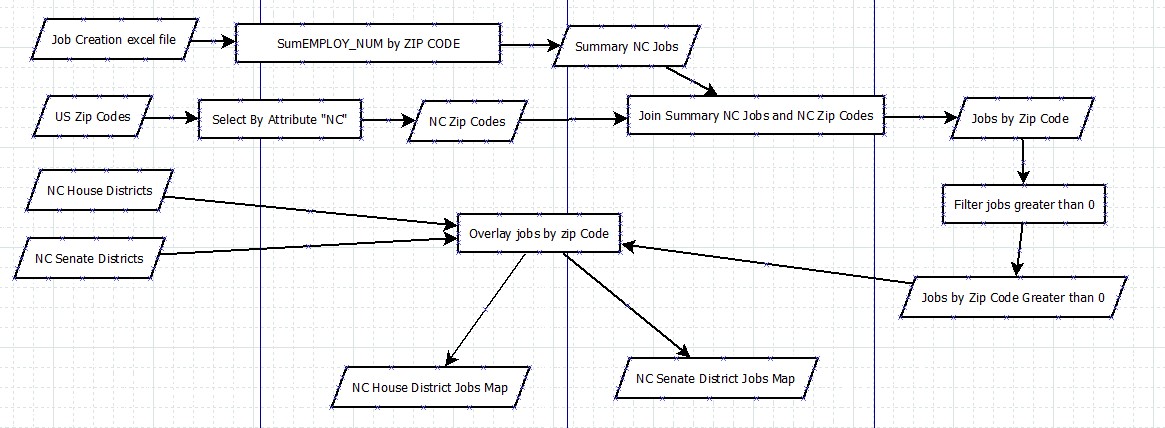
Utilizing ArcCatalog I first created a file geodatabase to hold the files that I had gathered from several sources. This allowed me to convert the excel spreadsheet of survey results into a table with ArcMap for manipulation. I added the files containing US Zip Codes, NC Senate, and NC House districts into the geodatabase created for this project. The first steps were to create a Zip Code file of only NC. I created this by the select by attribute feature with NC as the required argument. I then exported that selection into a Shape File called NC_ZipCodes.shp. This allowed me to narrow down the United States Zip Code map to just NC and therefore more manageable. I then began to summarize the data within the NC Job Creation Survey into a Summary file by Zip Code and the field containing the appropriate survey results “EMPLOY_SUM”. Opening the table, I selected the zip code numeric field and created a summary of the EMPLOY_SUM field. This created a summary file that contained the Zip Code, the total count of records in the zip code, and the total summary of jobs created in that zip code.
I then prepared the new file called “Sum_NC_Jobs” by adding a Text Field and using the Field Calculator to create the text version of the Zip Code. This field was what enabled me to join the table to the previously created NC_ZipCode file by using the Join attributes from a table with the common key of Zip Code. After the join was completed I then used the select by attribute procedure to select the zip codes that had jobs of greater value than 0. These results were then exported to a new feature class I called NC_Jobs.
After this file was created I was able to then overlay and manipulate the symbology to utilize Graduated Symbols based on the number of jobs created. The more jobs created the larger the circle/node displayed on the map. This was utilized to overlay and create two maps for the Senate Districts and the House Districts.
Process diagram / workflow diagram
Results

Application and Reflection
The tools utilized in this project could be used for many operations. Including a population’s analysis.
Problem description
I worked on a population analysis which used US Census data from NC and the result was to display showing either male population, female population or total population of a particular county and produce a map depicting those results.
Data needed
The data necessary to conduct this analysis was first US Census data from Fact Finder and NC One Map for state files to represent counties:
Fact Finder for Census DataNC Onemap
Analysis procedures
Utilizing similar files I had to import the census file into my database, but first had to manipulate the headings of the file and create filtered results upon selection of certain criteria. With the analysis I conducted on that these tools were essential to completing the task through joins and data being in the correct format to import into ArcMap with appropriate headings syntax and data type.