Working with US Census Data
Problem
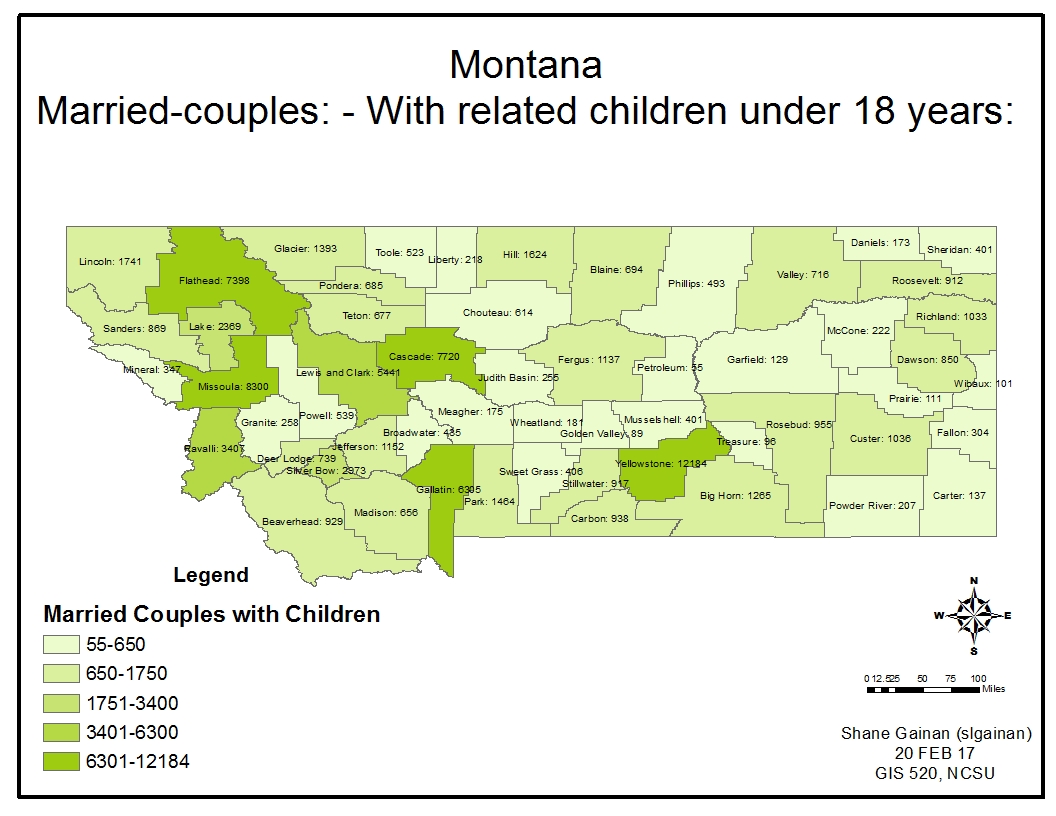
Working as a GIS analyst with the Office of State Human Resources, I am to develop a thematic map utilizing U.S. Census data showing the number of married couples with children under the age of 18 in the State of Montana by county.
- P035, “FAMILY TYPE BY PRESENCE AND AGE OF RELATED CHILDREN [20]”. This file contains the numbers of families in Montana that have children based on their age. It ranges from married to other families such as Male household with no wife, and female household with no husband. The ages of children are divided into age groups of 6 years and less, 6 to 17 and under 18 years old.
- The fields utilized in my tables were the GEO.id2 field in the .csv file and the GEOID10 field within the attribute table.
Analysis procedures
This section includes brief description of both the strategies and the methods/procedures used to solve the problem addressed in the assignment. It will include both a written description and a workflow diagram. The description should be a generalized description of the process used written in a paragraph format and should not be a detailed procedure log file nor a click-by-click description.
Strategies
The data in this exercise was comprised of an excel spreadsheet containing the census data of families in the State of Montana; Census 2000 Summary File 1 (SF 1) 100-Percent Data, P035, “FAMILY TYPE BY PRESENCE AND AGE OF RELATED CHILDREN [20]”. The census file also contained a metadata .csv file, with a notes and readme .txt file with explanations of the data. The geographic files used in this problem are 2010 TIGER/Line® Shapefiles: Counties (and equivalent) from the state of Montana. The primary tools used in this exercise was ArcMap and excel utilizing the join tools with in ArcMap to link the tabular data to the geographic feature data.
Methods
First utilizing excel, I opened the Family type by presence and age of related children .csv file to view the contents. I then compared that to the attribute table of the Montana Counties shape file in ArcMap to find a common field to link the counties and the tabular census data. This was easily identified as GEOid2 in the Census .csv file and corresponding GEOID10 field in the attribute table of the shape file. Noting the difference in field type I utilized a tool within excel to create the GEOid10 field within excel. This created a string file that I could then join within the attribute table.
The formula utilized in excel to transform and create the new field is =TEXT(B2,"0"). B2 being the GEOid2 column within the CSV File. I simply copied that formula in a new column, labeled it GEOid10 and saved the file as an excel (2003-2007) version with the .xls extension. This allowed me to import it into ArcMap and easily join the feature to the tabular data.
I chose to view Married Families, with children under 18 years of age. This was achieved by selecting the VD03 field by filtering out all the other fields imported from the file under layer properties fields and then selecting the desired criteria for the attribute table.
To symbolize the data I changed symbology to a graduated colors and then classified those numbers into five classes based of the field value of VD03.
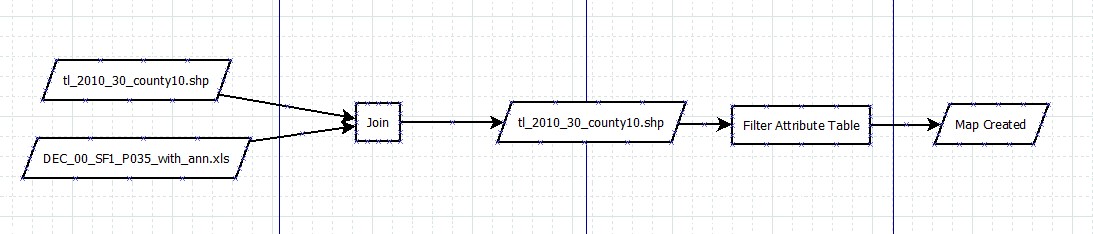
Process diagram / workflow diagram
Results
Application and Reflection
The data and information used in this project can prove to be very useful in all sorts of data analysis. Especially when you are working with data that you want to display by a particular map such as counties or districts.
Problem description
One example I can think of that this would be very helpful is in harvest reports of deer across the state of North Carolina for deer. Each year NC Wildlife Resource commission publishes data on the number of deer harvested by county. This coupled with a NC Counties map could give a graphical view of the numbers by county and show the counties that are harvesting the most vs. the least in a very graphical and visual way. Extremely beneficial to people that don’t have a lot of time to read the massive amounts of data. It is nice just to see a visual representation of that data.
Data needed
The data again for this analysis using NC as an example would come from NCOneMap as well as the NC Wildlife Resource Commission harvest reports published each year.
NC One MapNCWRC Harvest Data
Analysis procedures
Through the use of tools discussed on this page i would create unique fields in the harvest reports to enable me to join the field to the map layers by country or state what have you. This then would enable me to use symbology to display the harvest numbers. I would have to first ensure the data is normalized in the tables that are being joined to ensure accuracy but this could be used to either capture the census data of the number of hunters, number of attempted hunt days, and success rates by county.