Suitability Analysis
Problem
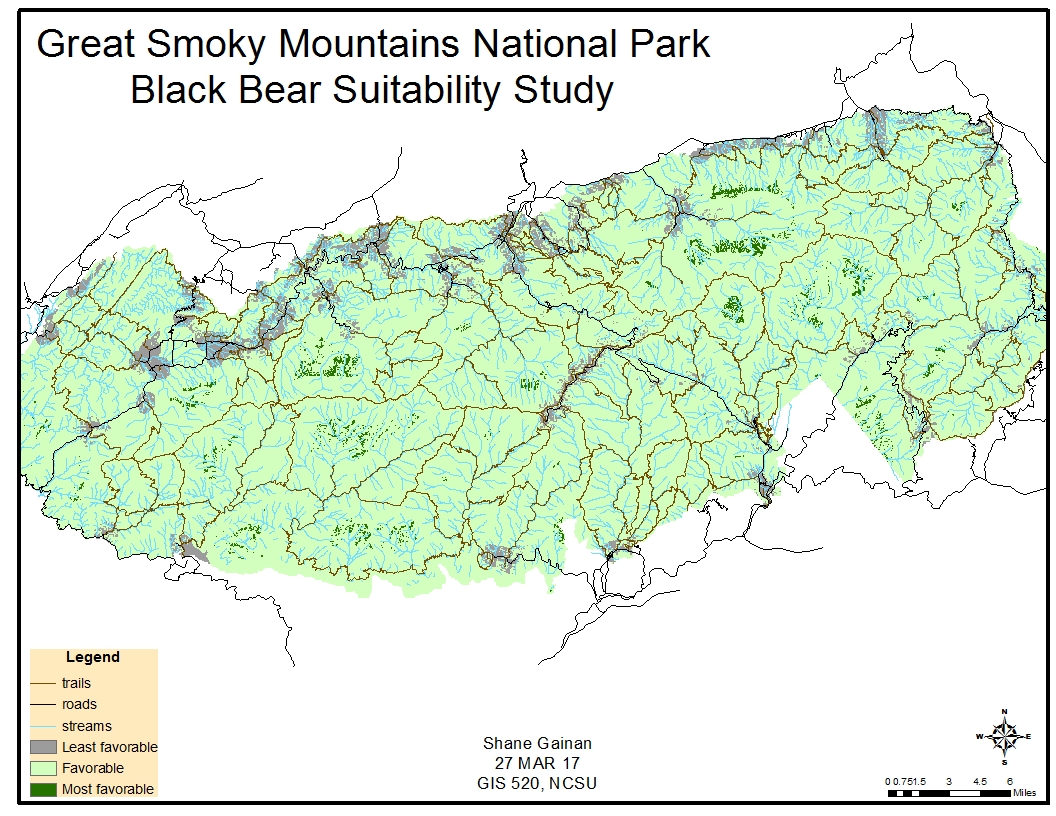
Create a map depicting the suitability of favorable land for black bear habitat within the Great Smoky Mountains National Park. This suitability study considers proximity of roads, trails and streams as well as the degree of slope and type of vegetation available for foraging.
Analysis procedures
Strategies
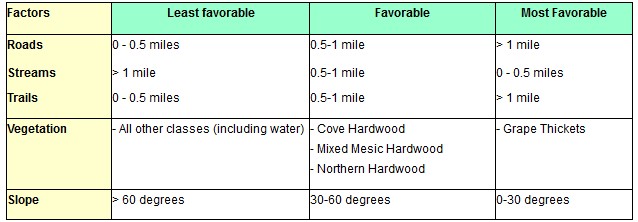
Add data to a blank map into ArcMap and define the workspace, geoprocessing scale and such within the environment settings of ArcMap. Creating a toolbox and subsequently a new Model to utilize several geoprocessing tools to include Feature to Raster, Slope, and Euclidean Distance. I then used the reclassify tool to categorize the various output files into three classes as depicted in the table above. Finally adding the weighted overlay with an equal weight on all five factors. After running the model a new map was created with the Most Favorable areas, Favorable, and Least Favorable areas that black bear would inhabit.
Methods
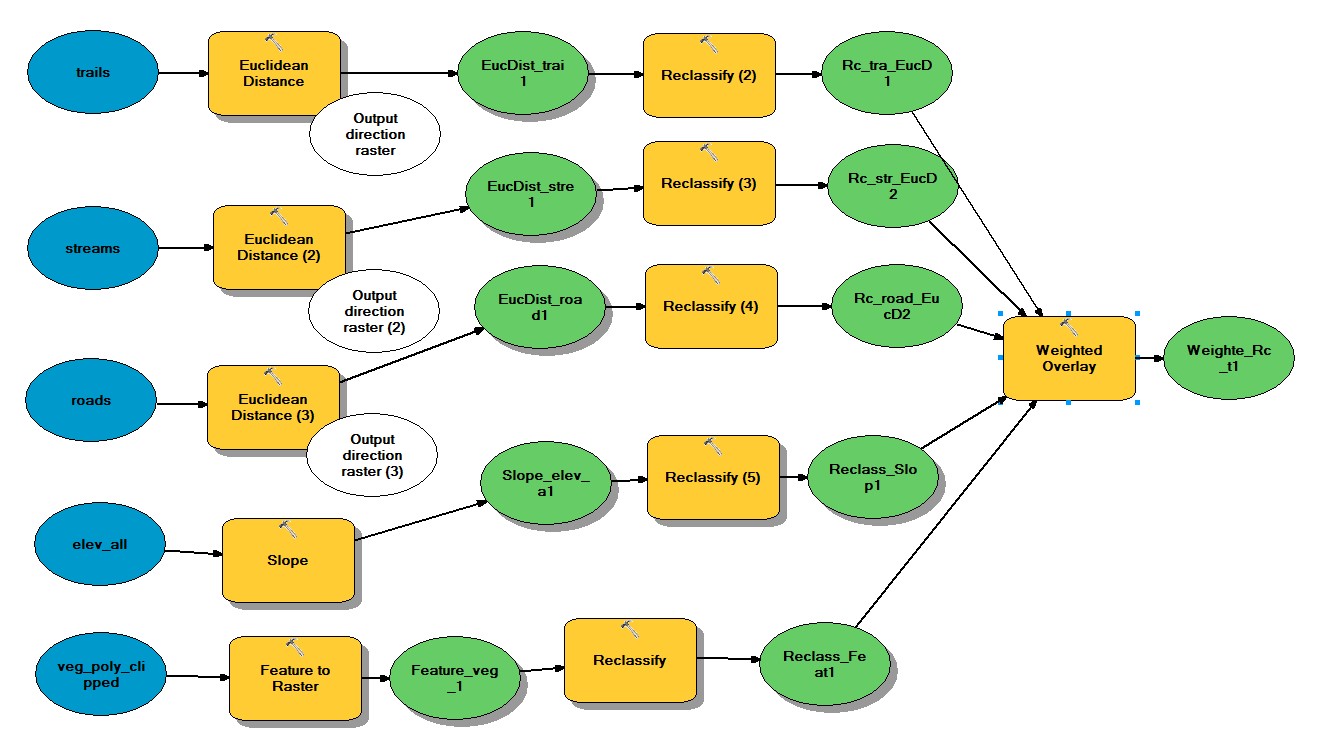
Within the newly created tool box and Model created for this exercise we added the Feature Class files of the Roads, Streams, Trails, and vegetation, as well as the elev_all raster data set to begin the initial phase of the Model. I had to first convert the roads, streams, and vegetation to distances utilizing the Euclidean distance tool set and converting it to meters (1609.344m being equal to 1 mile) this allowed me to reclassify in the next step. I then had to convert the Vegetation into raster data to extract the class of vegetation in the map. This was then reclassified into the separate categories as outlined in the table above. The Slope was determined by utilization of the Slope tool in order to capture the Degree of incline of the mountain ranges within the study area. All five outputs were then reclassified into three categories of either Least Favorable, Favorable or Most Favorable and given the weights of 1, 2, and 3. 1 being the least Favorable. After reclassification I used the weighted overlay tool to determine the appropriate weights to give to each reclassified file and how they would affect the study area. Upon completion of running the exercise it was clear that the majority of the forest was favorable to black bears, with a few areas of Most Favorable and Least Favorable.
Process diagram / workflow diagram
Results
Application and Reflection
I think the skills in this exercise can be used in a wide variety of analysis. In almost every facet of development we want to determine the effects of something on something else and find areas that the effects would not be devastating to something.
Problem description
An example I can think of is trying to build a new weather monitoring station that would be best located to capture significant weather events yet not be destroyed in the event. You could get the weather phenomena data and damage assessments from FEMA or other Government Agencies and then incorporate that into a model determining the factors you wish to set as parameters for the analysis.
Data needed
You can download FEMA Data here:
FEMA Data FeedsState and County maps can be downloaded from similar sites as other topics in this portfolio such as:
NC OneMapas well as satellite imagery
Earth ExplorerAnalysis procedures
by first calculating distances of storm events from certain features you select as criteria such as hill tops with certain elevations. then build your model incorporating roads, trails, streams, water bodies, types of forest etc. to determine the best locations for your site. Very similar to what we have done with the data above for the Bear Study.