Linear Referencing
Problem
The problem in this exercise was to identify a stretch of road in Pitt County by conducting various linear referencing methods and utilize the tools within ArcMap to display, highlight specific events along routes within the provided files.
Analysis procedures
Strategies
The data in this exercise was comprised of feature classes of the county and cities within Pitt County. There were also several database included with data pertaining to pavement sections, accidents, and routes within Pit County. With this data, I used several tools related to linear referencing to extract certain data and display information by combined information from the different databases by implementing several tools with in ArcMap.
Methods
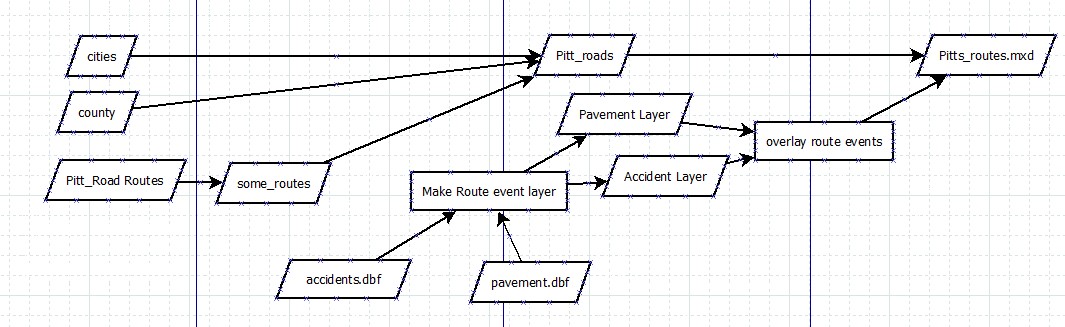
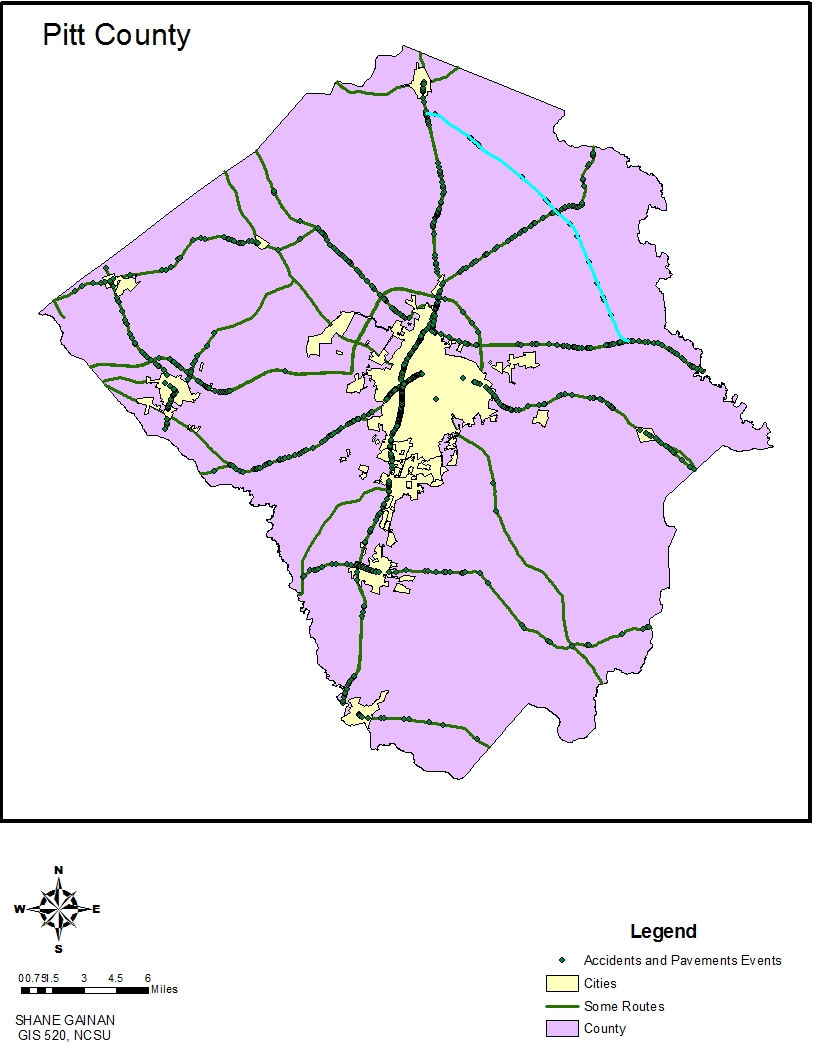
First steps in the process were to import the county and cites shape files to get a lay out of the county followed by importing the Pitt_Roads_Routes information, specifically the Some_Routs tabular data from the database file. At this point we had a map of the county, cities and all the roads in the county. Routes are made up of many segments of roads within the county.
To conduct linear referencing along these routes we first had to import the pavement.dbf tabular data and utilize the Identify Route Locations and Make Route Event Layer tool to extract the information necessary to create the end result which showed the accidents along paved roads and determine a correlation of those accidents greater than 75 and those less than or equal to 75 from a Ratings data. I accomplished this by the use of extract by attribute to get the correct number of occurrences with those specifications along a specific route.
The assignment was a step through of these various tasks with a check on learning by providing specific answers in regards to the data extracted from the hand out accompanying this short right up of the processes I completed.
Process diagram / workflow diagram
Results
Application and Reflection
The application of this process could be used in many ways. One way that I could think of was actually during my time in Iraq in 2003-2004.
Problem description
We kept a spreadsheet of attacks that occurred with grid coordinates and such to show were the enemy was and when in those areas to be on alert and ready for a TIC. “Troops in Contact”. Of course that spreadsheet and the use of maps of the region and roads could have painted great picture of the battlefield and enemy activity. Instead we used excel and spreadsheets plotting dots on a picture in PowerPoint of the general location. That is kind of funny when I think about the application of this technology for soldiers on the battlefield. Being as it was then coming out of Clintons Presidency, this technology was not even known about to the average soldier due to the ignorance of politicians and military tactics. But so much has changed in the past 15 years..
Data needed
For my example the data would come from classified systems but similar to the accidents but of attacks, route status etc.
Analysis procedures
To conduct linear referencing along these routes we first had to import the pavement.dbf tabular data and utilize the Identify Route Locations and Make Route Event Layer tool to extract the information necessary to create the end result which showed the accidents along paved roads and determine a correlation of those accidents greater than 75 and those less than or equal to 75 from a Ratings data. I accomplished this by the use of extract by attribute to get the correct number of occurrences with those specifications along a specific route.