Using Raster Data for Site Selection
Problem
Complete the ESRI Training on Using Raster Data for Site Selection. In this course there were several exercises to go through to learn the different methods of Using Raster Data for Site Selection. Due to being an exercise I did not produce any maps to display in the results. However I drew out a diagram of the process that would be used on any Site Selection Analysis.
Analysis procedures
Strategies
There are three ways to perform site selection; Binary site selection, Weighted site selection, and Fuzzy logic. Which method to use is largely based on the data and or question you are trying to answer. Using Binary and Weighted Site Selection are used if your data has clearly defined boundaries while using Fuzzy Logic if for a site selection that does not have a defined boundary. Some examples given in the ESRI training would be when you are looking for animal habitats or vegetation areas of specific plants. While using Binary or Weighted site selection would be for something with defined boundaries such as
Methods
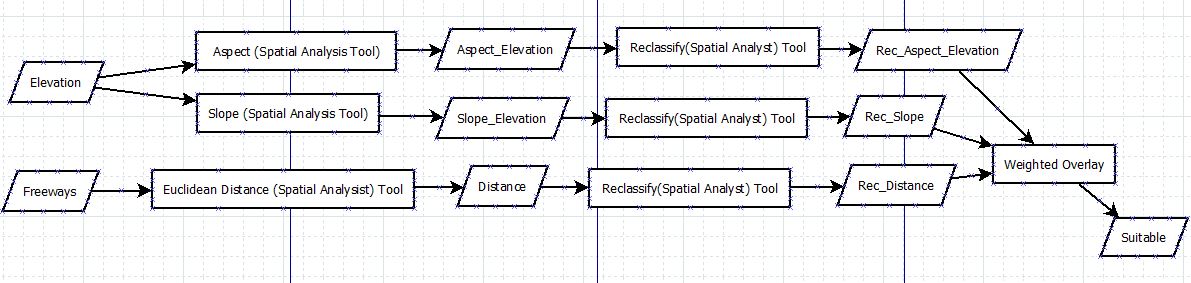
Due to the many different uses of each model, I am showing the Weighted analysis diagram below of one of the exercises used in the completion of the Raster Data Course.
With any analysis the first step is to define the initial data by using various tools such as slope, Euclidean Distance, Aspect. etc... Following that you have to reclassify the outputs to more closely define the requirements you are looking for outputs.
Using those reclassified products you can then incorporate that into a weighted analysis tool or the other methods by giving weights to specific features that are more suitable than others thus allowing the analysis to determine the best suited boundary or area for your study.
Process diagram / workflow diagram
Results
Application and Reflection
Problem description
An example of where this can be used can be seen under the Suitability analysis of the Bear Study in the Great Smokey Mountains or any similar analysis were you are using raster data to determine the probability of the area being suitable or not suitable.
Data needed
Raster Data of area you would like to study or create a Raster Data set to use in the analysis. Appropriate shape files of the other areas you want to incorporate in the study. You can find this data on many of the links i have already shared in this portfolio for additional data.
Analysis procedures
In this new data set and problem i would use the weighted analysis tool to assign weights to specific attributes that would make the area more suitable. The methods would be very similar to what I have outlined in this workflow diagram as well as the workflow diagrams depicted in the Suitability Model of the Bear Suitability study.